

Last updated: October 31, 2026
47% of media professionals said "data or research" is what they want PR teams to send them more of. That was the top answer in a PR software company's 2026 survey of 1,899 media professionals, influencers and bloggers in 19 markets, fielded in January and February 2026. Respondents could pick more than one resource. Embargoed or early access information came second at 45%, access to experts third at 42%, and press releases only got 22%.
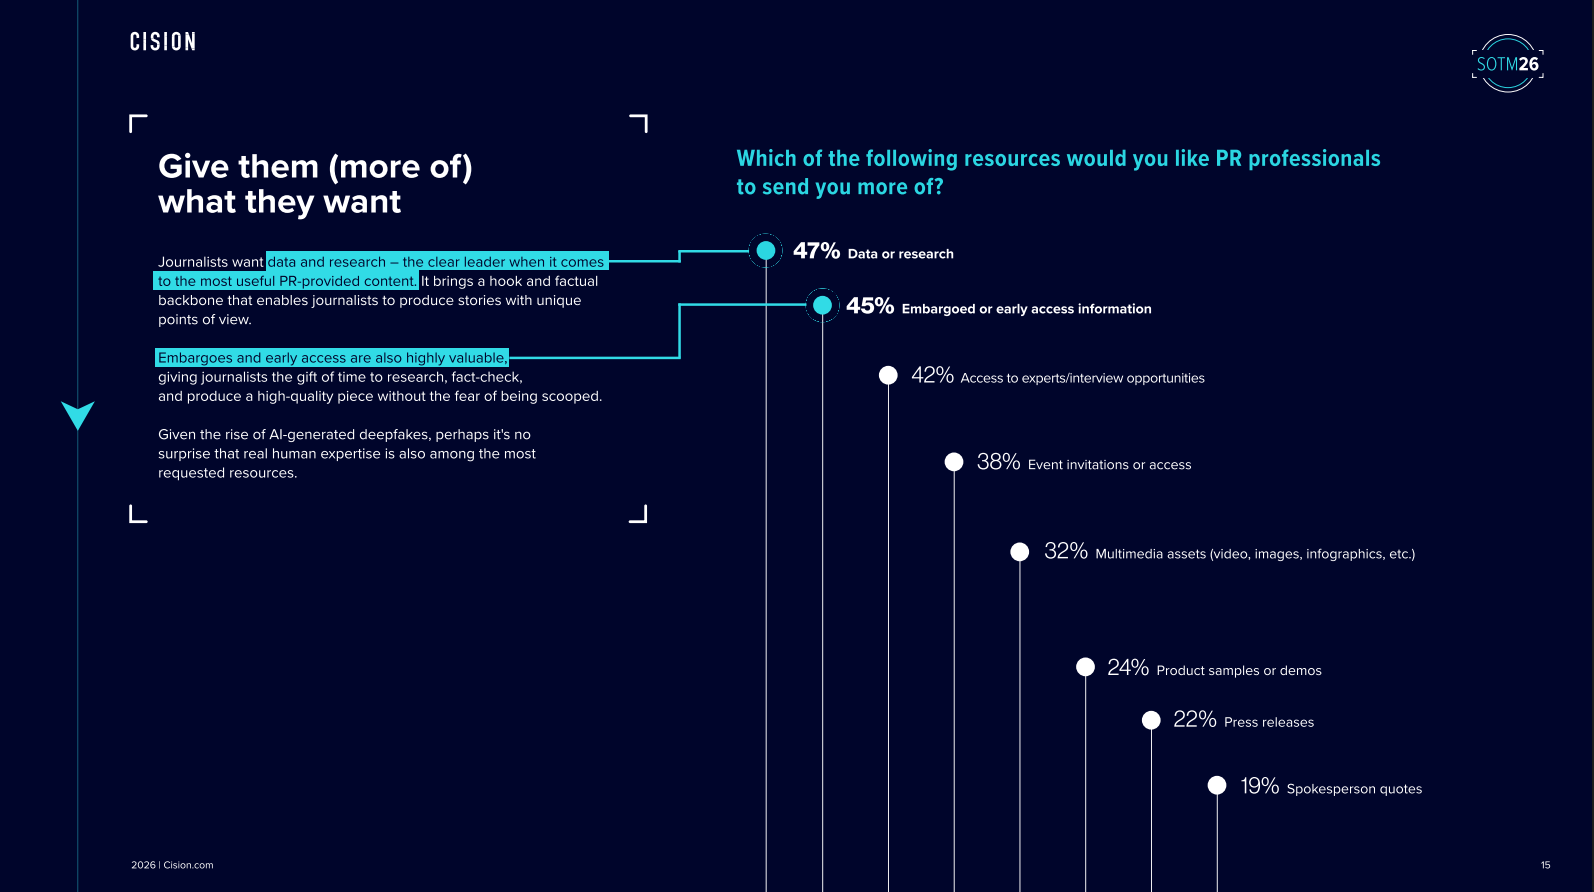
Cision 2026 survey: 47% of media want data or research.
That number measures what reporters ask PR teams for. It says nothing about what AI engines cite, or what reporters end up quoting.
For a B2B company, publishing your own data is the most dependable way to earn citations from journalists and from AI answers, as long as you run it like a product. That means a narrow question, a written method, one permanent URL and a refresh every year. A big launch with no method notes may get a burst of attention, but nobody can check it, so it rarely gets cited for long.
The AI side leans the same way for its own reason. Assistants have little reason to cite one more rewording of a definition that already exists on many pages. They do need a source for a number that only one page holds.
This guide sits under the AEO pillar, which explains how answer engines choose sources. For how this work differs from classic rankings, see AEO vs SEO.
Why your own data gets cited
A journalist covering your category needs a number to anchor the story and a source they can name. An AI engine answering a question needs a passage it can quote and a page to point to. Either way, the thing they're hunting for is a fact that only one place can supply.
Google's guidance on creating helpful, reliable content, last updated October 5, 2026, opens its list of content and quality questions with this one: "Does the content provide original information, reporting, research, or analysis?" Google also counts originality among the attributes its Search Quality raters are trained to evaluate, defined as "unique, original information or perspectives that aren't already available on other websites." That page is about Google Search and makes no promise about any AI engine. It's still the plainest official statement of the target.
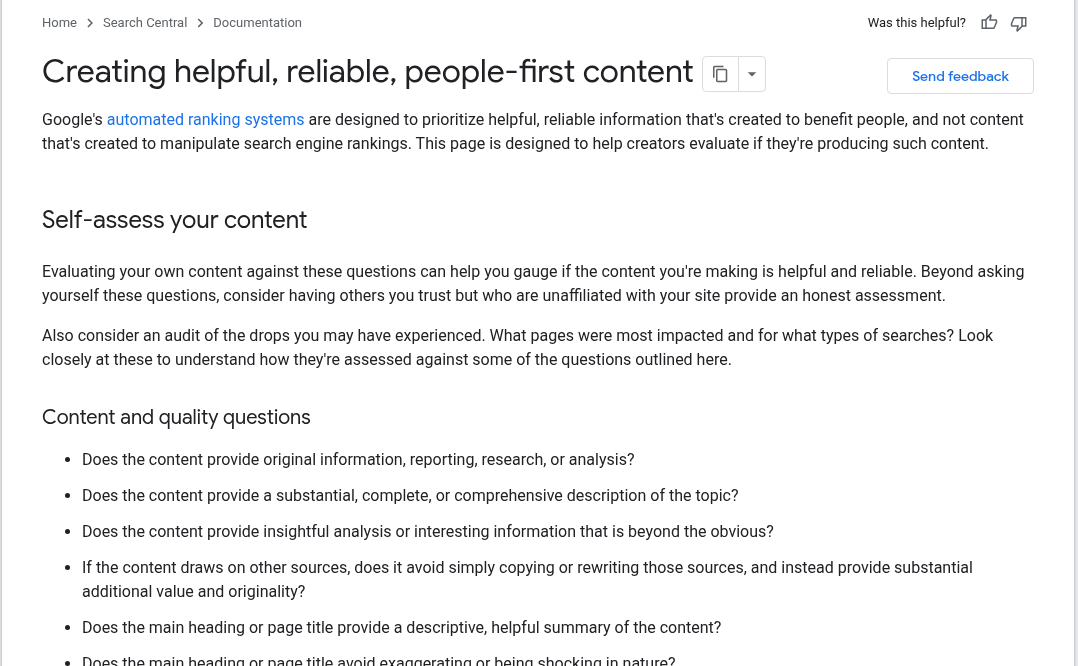
Google's helpful content guide asks if content provides original information.
The supply side explains why this matters now. The CMO Survey, run by Duke University's Fuqua School of Business and fielded January 7 to 29, 2026 among senior marketers at US for-profit companies, asked how companies use AI in marketing. Content creation was the most common answer, checked by 73.9% of the 188 marketers who answered that question. With that much copy coming out of the same kind of tools, the pages that stand out are built on something those tools can't produce.
Pick a question only your data can answer
Most teams start with a dataset and ask what it says. Flip that. Start with a question your buyers or the press already ask, then check whether you can answer it better than anyone else.
A research question worth your time passes four checks:
People already ask it, in sales calls, support tickets, forum threads or press coverage of your category.
The answer is a number. A question about how long a process takes at companies of a given size works. A question about whether a trend is "important" doesn't.
Your data covers it, because you have the records, the audience or the access to collect a credible sample.
The answer moves over time, which gives you a reason to update and gives readers a reason to come back.
Write the question as one sentence before you collect anything. If you can't, the project isn't ready.
Then draft the headline you hope to publish, leaving a blank for the number: "[Share] of [type of company] now [behavior], up from [previous share]." Fill in the company type and the behavior now, and leave the two shares blank until the data is in. If a journalist on your beat wouldn't care about that headline, choose another question.
Three cheap sources of data
You don't need a research department. Most B2B companies already have one of these.
Your product is the first place to look. If it processes records of any kind, aggregated and anonymized usage patterns are the most defensible data you'll ever publish, because nobody else has them. Think median time to complete a core task, the share of accounts using a given feature, or how a key metric varies by company size. Read your terms of service and privacy policy before publishing, and aggregate so that no customer can be identified.
A short buyer survey can answer what product data can't, such as what buyers believe, plan or worry about. Send it to your list or a panel of people who match your buyer profile. Keep it under ten questions, ask about behavior wherever you can, and publish the exact wording of each question.
Size the list before you write the questions. The CMO Survey's 2026 topline, linked above, reports inviting 2,111 marketing leaders and getting 308 responses, a 14.6% response rate, and only 188 of them answered the AI-use question. At that rate, a 1,000-contact list gives you about 146 responses, and 300 responses would take roughly 2,050 invitations. Expect fewer answers on each individual question, and a lower rate from a cold list.
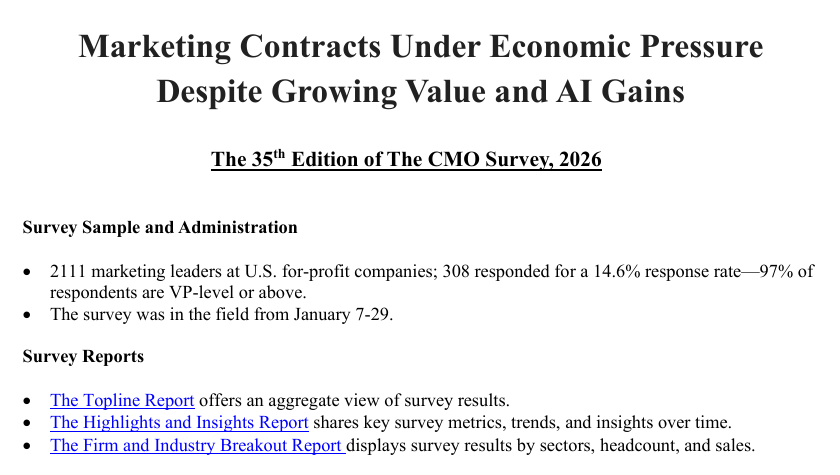
CMO Survey 2026 sample: 2,111 marketing leaders, 308 responses, 14.6% rate.
Public data works too, if you collect it systematically. Examples include pricing pages across your main competitors, job posts that mention a particular skill, or how many sites in your category publish a certain kind of page. The pages are public, but the collection and the analysis are yours. Log the dates you collected everything, because public pages change.
Pick one source for your first edition. Mixing all three makes the method harder to explain and the findings harder to trust.
Method notes: the part most companies skip
Journalists and careful readers will check your method, and so will anyone deciding whether to repeat your number.
Every research page needs a short method section in plain language. It should cover:
Who or what you measured, and how many, such as the count of accounts in one region or of respondents who met a stated qualifying criterion.
When the data was collected, separate from the publish date. If you inferred a date, say so.
How you define your terms. If you count "active users," spell out what active means.
What the data leaves out. Your customers aren't the whole market, your panel isn't random and your crawl misses sites that block bots.
Your interest in the result: what you sell in this category, and the fact that you benefit if the findings get attention.
Writing that last line feels awkward, and it helps you. Readers already assume a vendor has a stake, so saying it plainly shows there's nothing hidden.
Put the full method on the research page itself. A PDF behind a form can't be quoted by a crawler that never fills in the form.
Package findings so they can be cited
One finding per heading
Write each main finding as a heading that contains the number: "[Share] of [group] [did thing] in [year]." Fill in each bracket from the finding itself. A model scanning for a quotable passage gets a complete claim in one line, and so does a journalist skimming the page.
A summary someone can quote whole
Open with three to five sentences that give the main findings with their numbers, the sample and the dates. Someone who quotes only that paragraph should still be accurate.
Charts, alt text and tables
Write alt text that states the finding, with the chart type, the share, the group and the breakdown. That tells a reader far more than "chart 3." Alt text is the only text version of a chart unless you add one, so add one. Put the numbers in an HTML table under each chart, where they're easy to extract and easy for a journalist to check.
One permanent URL
Give the research a single address, such as a /research/ path followed by the topic, and update that page each year. Skip addresses that end in -2026 one year and -2027 the next. Older editions can live on archive pages that link to the current one.
A ready-made citation line
Add one line people can copy: "[Company], [Report name], [month year], [URL]." Fill in your company, the report title, the publish month and year, and the permanent URL.
Structured data can also help engines understand what the page is. The guide to schema markup for AI search covers which types are worth adding.
Getting it in front of journalists
A research page nobody links to or mentions will struggle to reach either audience, so plan the outreach before you publish.
First, a closer look at the survey in the intro, since it shapes what you send. It's Cision's 2026 State of the Media Report, released May 13, 2026. Cision sells PR software, including a media database and the PR Newswire distribution service, so it has a commercial interest in reporters finding PR material useful. The survey was emailed to members of Cision's own media database, whom Cision vets "as media professionals, influencers, and bloggers," and was also offered to the PR Newswire for Journalists database. Staff reporters are only part of that group. Cision also notes that respondents could choose more than one answer on some questions, so the percentages add up to more than 100. Read the 47% as a fair guide to what Cision's media contacts ask for. It's a weaker guide to journalists in general. The order still tells you something: "data or research" came first and press releases came near the bottom.
Cision's 2026 State of the Media report landing page.
Start with the reporters who already cover your category. Read their recent pieces, then pitch the one finding that fits their beat, with the number in your first line and a link to the method. Skip the PDF attachment and the mass send.
For one or two reporters, offer something extra: an early look under embargo, a cut of the data by a segment they care about, or an expert to interview. Those were the second and third most requested resources in the Cision survey.
Make your expert easy to verify. The person quoted should have a page on your site and a public profile that matches their title and the topic.
Expect most coverage to arrive weeks or months later, when a writer searching for a number in your area finds yours. Research is good at that kind of slow pickup, and the permanent URL is what lets it add up. A named mention with a link is the best result, and a named mention without a link still helps. The guide to brand mentions vs backlinks covers how the two compare.
Refreshing without breaking the canonical
The yearly update is what turns a one-off report into a lasting asset, and it's also where teams most often throw away the links and mentions they've earned.
Keep the URL. Update the existing page with the new numbers, change the dates in the summary and the method, and add a short section on what changed since the last edition.
Move last year's numbers to an archive page and link it from the current one. Give the archive a self-referencing canonical, because it's a separate document with its own data.
Avoid moving the live research to a new year-stamped URL each year. Google's documentation on consolidating duplicate URLs, last updated July 10, 2026, calls a redirect "a strong signal" that the target should become canonical. So a yearly move hands the canonical to a new address every year, and everyone who linked to the old one now depends on a redirect.
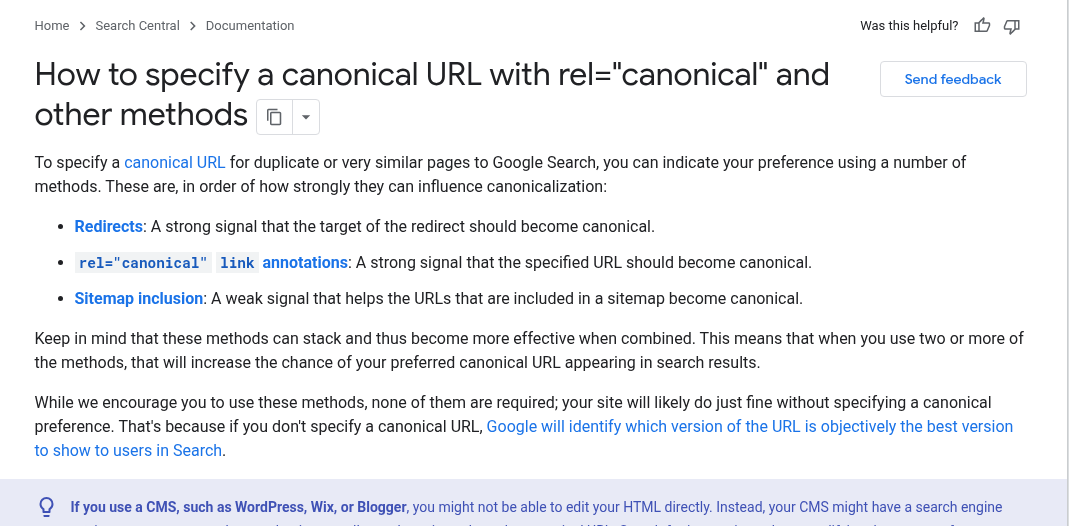
Google's duplicate URL guide lists redirects as a strong canonical signal.
Change the published or updated date only when the content changes. A new date on old data is the kind of thing that makes readers doubt the rest of the page.
Which situation are you in?
If you've never published research, start with product data if you have it, since it's the hardest for anyone to copy. Publish one finding with a full method, then give it a quarter to see who picks it up before you plan a bigger edition.
If your yearly report lives in a gated PDF, ungate the findings. Put the summary, headings, charts, tables and method on a stable URL, and keep the PDF as an optional download if sales wants the leads.
If you have data but no time, run a single-question study: one question, one chart, one table, one method paragraph.
If you're in a regulated category, get legal review of the method and the wording before you publish, and anonymize more aggressively than you think you need to.
If you already get press but no AI citations, look at the page layout. When findings sit in images and PDFs, AI engines may cite the articles about your research and skip the research page. The guide on how to measure AI search visibility shows how to test which page is being cited.
What to watch out for
A survey of the handful of customers who attended one webinar isn't market research. Say exactly who answered and don't stretch the result to anyone else.
If you sell a product the research supports, say so on the page. Reporters will find out anyway.
Leading questions bias the answer. Asking how much time a process "wastes" takes the waste for granted, so ask what people do and how often.
Restating someone else's statistic doesn't make it yours. If you build on public data, your contribution has to be the collection or the analysis.
A number without a collection date is hard to cite and easy to misread. Put the date in the headline, the summary and the method.
If the pitch claims more than the data shows, the journalist who checks will stop opening your emails.
Final thoughts
Start smaller than you think you should, and make the method section the best-written part of the page. Getting other sites to reference finished research is digital PR work, and Miraa's link building and digital PR page describes that service.