
Last updated: November 16, 2026
In the 365 days to November 13, 2026, the biggest search engine's public status log recorded eight core and spam updates, and at least one of them was rolling out on 73 of those days. By our count, that's one day in five. Pick any date a site's traffic started falling, and there's roughly a 20% chance an update was live that day by coincidence alone.
So "it lined up with an update" proves very little. This guide covers how to tell if a Google update hit your site with more than timing: five signs, each checked in Search Console or on a public Google page, that together separate an update hit from a tracking error, a seasonal dip or a bug your team shipped.
If you haven't yet ruled out the everyday causes of a drop, start with the 10-check organic traffic drop checklist. This page picks up at its third check, the update question, and goes deeper.
Sign 1: The drop starts inside a confirmed rollout window
Google posts its confirmed ranking updates on the Search Status Dashboard. Go to status.search.google.com, scroll to Ranking and click View history, then open the update row you suspect. The incident page gives three things you need:
The exact start time. The November 2026 core update began at 10:06 on November 10, 2026, US/Pacific.
The expected rollout length. For that update the entry gives "up to 2 weeks".
The status icon. A blue information icon with no end date means the rollout is still running.
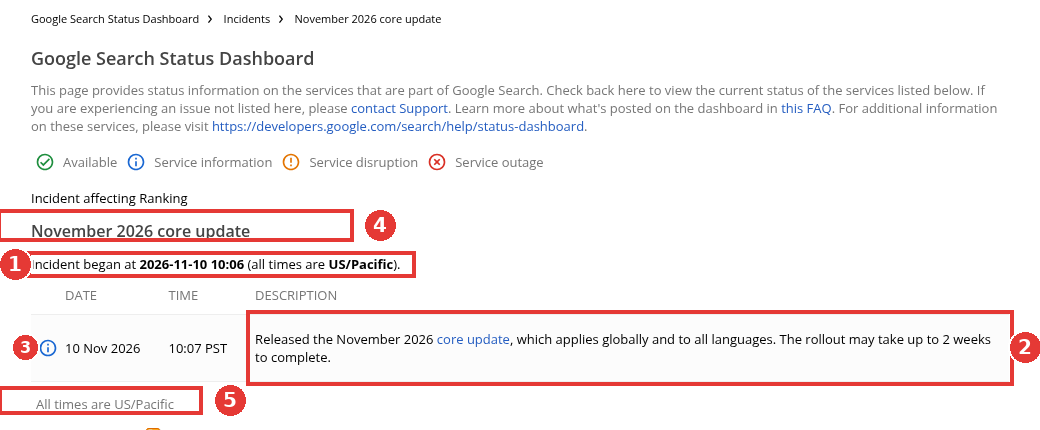
November 2026 core update incident page, captured Nov 14, 2026.
Every past window is on the history page. Core updates in the last year ran between 11 and 18 days: May 2026 took 11 days and 21 hours, March 2026 took 12 days and 4 hours, and December 2025 took 18 days and 2 hours. Spam updates are often shorter; the March 2026 spam update finished in under a day.
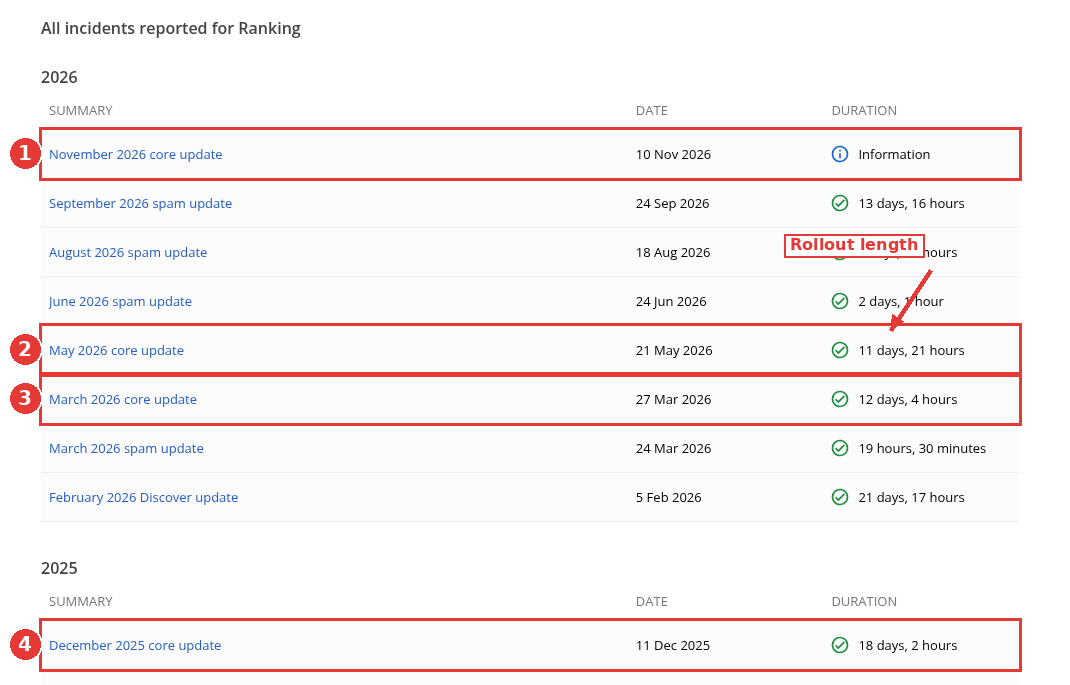
Ranking history with the core update rows numbered, captured Nov 14, 2026.
The dashboard and Search Console both use Pacific time, so no conversion is needed when you lay one over the other. A drop that begins two days before a window opens fails this sign. A drop that begins on day 9 of a 12-day rollout still passes, because sites don't all move on day one.
I don't count the unconfirmed tremors that SEO tools flag between official updates. Without a dashboard entry, there's no window to test against, and a volatility score from a third-party tracker can't stand in for one.
Sign 2: It's a step down that holds after the rollout ends
An update hit looks like a staircase: the line drops during the window, then settles at the new level. A slow slide that began months earlier and simply continued through the window is a different problem.
To check, compare equal periods on either side of the window. The organic traffic drop checklist covers the Compare presets, chart annotations, the complete-days default and how to sort the Pages tab. This page only needs the custom ranges around a confirmed window. Set the first range to the 28 days before the rollout started and the second to the 28 days after it ended. Leave the rollout days themselves out of both ranges, since rankings are still moving then. For the September 2026 spam update, which ran from September 24 to October 8, that means August 27 to September 23 against October 9 to November 5. Turn on Total clicks, Total impressions and Average position. Search Console draws the first range as a solid line and the second as a dotted one, and each totals card shows both ranges with their dates.
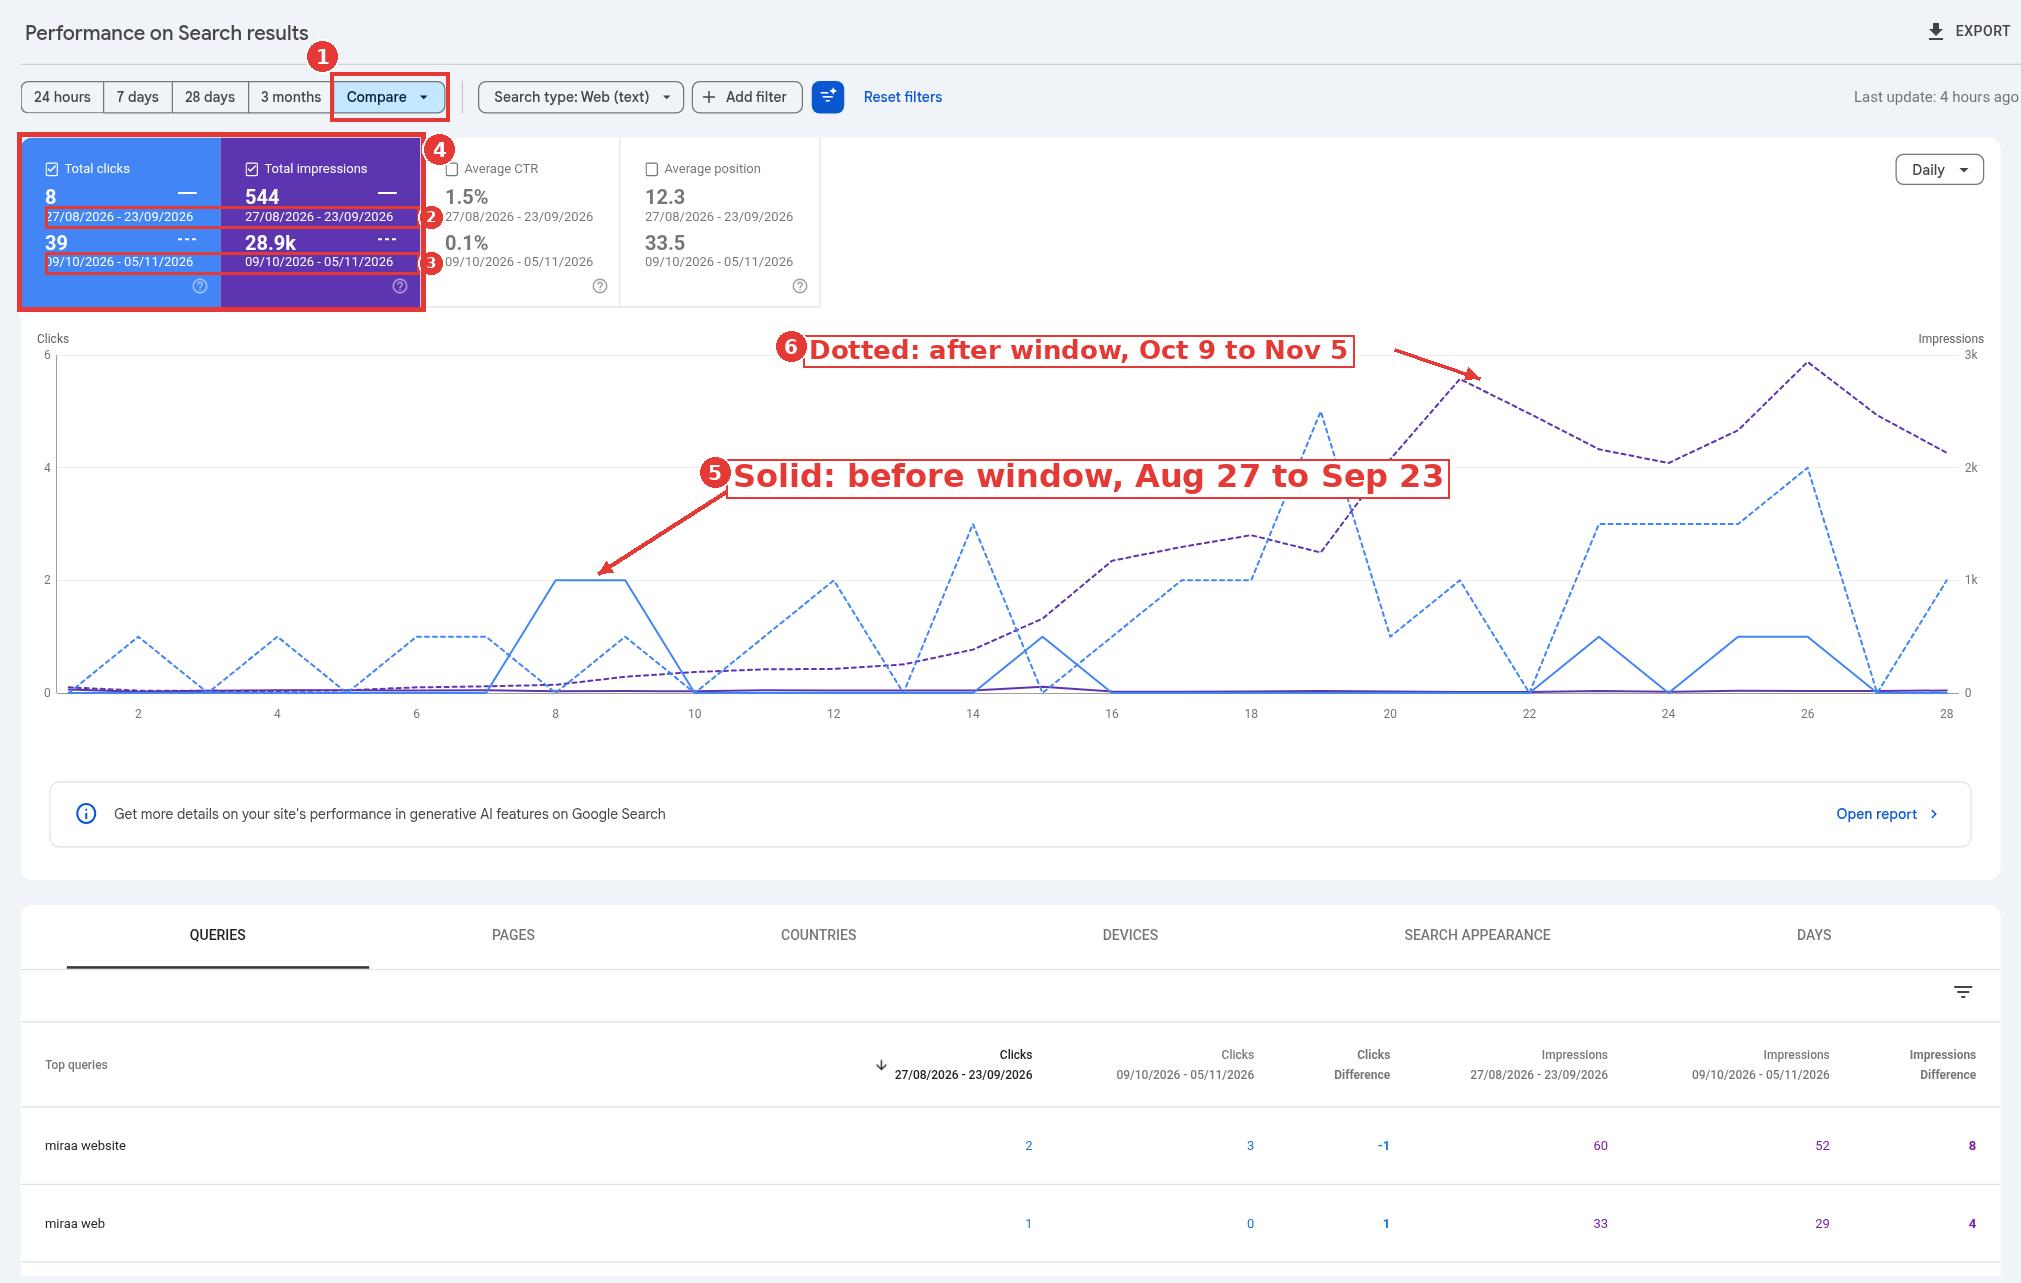
miraa.io custom compare around a spam window, captured Nov 14, 2026.
miraa.io rose after this window, so the screenshot is a no-hit reading, not a staged drop.
For the November 2026 core update, this sign can't be tested yet. As of November 14, 2026, the rollout hadn't finished, and the after-window can only start once it's complete.
Sign 3: Rankings fell, and the losses cluster
An update moves rankings. If clicks dropped while average position held, look at the results page and your snippets first; that's a click-through problem, and an update is a weaker suspect.
On the pages that lost the most clicks, and on their queries, two patterns point to an update:
The losing pages share a type. All the comparison pages fell, or the thin glossary pages, or every post written in one quarter, while product and docs pages held.
Positions fell a long way on many queries at once. Small moves, such as position 2 to 4, happen all the time and often reverse on their own. A fall from position 4 to 29 across a wide range of terms is what an update hit looks like.
Losses scattered across random pages with small position changes fit normal churn better than an update.
Sign 4: Demand for your queries didn't fall at the same time
A query can lose traffic because fewer people searched it. Seasonality is the most common false positive in update diagnosis, because Google ships updates in every season.
Take your five biggest losing queries from sign 3 and check each in Google Trends at trends.google.com: set the country you sell in, set the range to Past 5 years and look at the same weeks in earlier years. If the term dips every year in those weeks, the calendar explains at least part of your drop. If search interest held steady while your clicks fell, demand is ruled out.
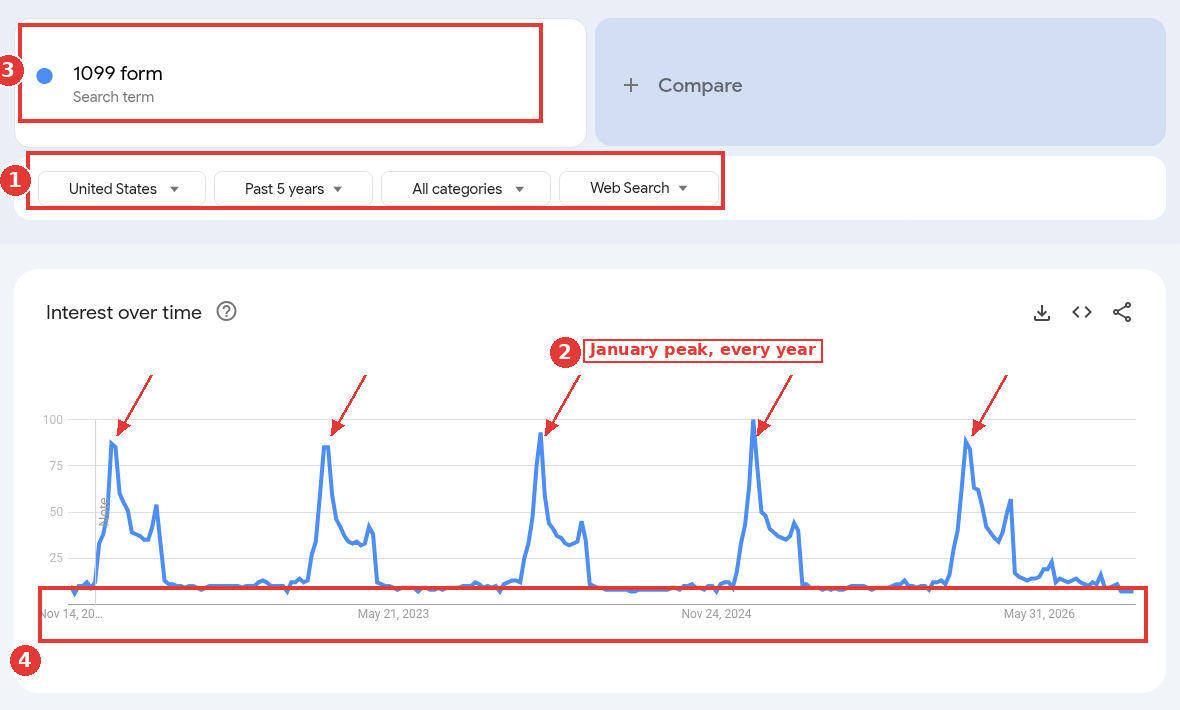
Google Trends, "1099 form", US, past 5 years, captured Nov 14, 2026.
The 1099 form query above shows what pure seasonality looks like: a sharp January peak every year and a long flat stretch in between. A site whose traffic tracks a curve like that will "drop" every February no matter what Google ships.
Inside Search Console, the year-over-year comparison does the same job for your own site. Use "Compare last 3 months year over year" from the date filter, and if last year's line dipped in the same weeks, discount the drop by that much before you blame an update.
Sign 5: Nothing else changed the same week
The last sign is negative. An update gets the blame only after the other suspects have alibis for that week:
No matching entry on Search Console's data anomalies page.
No deploy, migration, redirect change or CMS release in the two weeks before.
No jump in not-indexed pages under Indexing > Pages.
No message under Security & Manual Actions.
The chart below shows this test on miraa.io's own Search Console data, as a healthy baseline. The number of queries ranking on page one rose sharply from October 28. No dashboard entry covers October 9 to November 9, so the attribution test rules out an update for this move, and the cause has to be found on our side of the fence. The same logic applies to a drop.
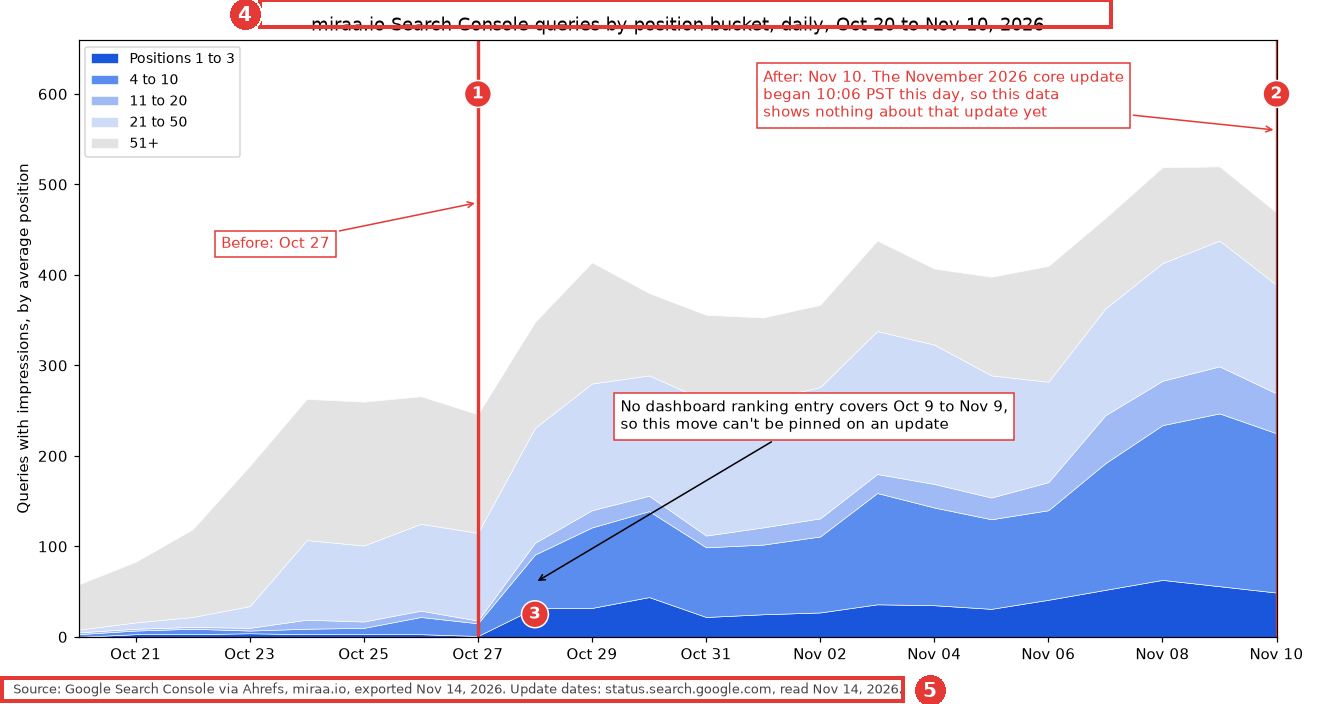
miraa.io position buckets rose with no update, captured Nov 14, 2026.
Note where that data stops. November 10 is the day the November 2026 core update began, so the chart shows nothing about that update's effect on our site.
How to score the five signs
I treat signs 1 and 2 as the gate. If the drop didn't start inside a window and settle after it, stop calling it an update and go back to the drop checklist.
If both pass, signs 3 to 5 decide how confident you can be. All three passing makes an update the most likely cause. One failing usually means a second cause stacked on top, such as an update that landed during a seasonal low. Two failing means timing is doing all the work, and with update windows covering one day in five, timing alone is weak evidence.
A worked attribution, with our math
Take a hypothetical SaaS blog that averaged 1,000 clicks a day in the 28 days before a core update began and 700 a day in the 28 days after it finished.
Raw change: 30% down.
Last year, the same two periods showed an 8% dip. Adjusted for season, the unexplained loss is about 24% (0.70 divided by 0.92 is 0.76).
Trends for the top five lost queries: flat. Demand ruled out.
Pages tab: 80% of the lost clicks came from listicle pages, which fell from positions 3 to 5 to positions 12 to 20.
No anomaly entry, deploy or indexing change that month.
All five signs pass, with about a quarter of the drop left to the update after the season is removed. That 24% figure is the one to plan recovery around, and the listicle cluster is where to start.
How to recover: route by update type
Once the signs point to an update, the update type sets the plan.
Spam update. Recovery means finding the spam policy you're closest to breaking, fixing it across the site and waiting for the systems to reassess. A step-by-step spam recovery guide is coming on this cluster. If Security & Manual Actions shows a manual action, that's a separate process with a reconsideration request.
Core update. There's often nothing to "fix" in a technical sense; other pages are judged more useful for the queries you lost. The work is a site-wide content review of the losing page types, and recovery tends to show up over months, often around a later core update. A guide on why sites don't recover from core updates is scheduled too.
Feed update. The February 2026 Discover update changed traffic from Google's mobile content feed, not from web search. Check that feed's report under Performance; your web search numbers shouldn't move.
Not an update. Go back to the traffic drop checklist and work through the checks the signs didn't cover.
For B2B SaaS teams where the core update losses sit on commercial pages, comparison posts and integration pages that feed pipeline, the content review is the costly part, and it's the kind of program a B2B SaaS SEO agency usually runs alongside the in-house team.
FAQ
How long after an update should I wait before judging it?
Wait until the dashboard marks the rollout complete, then gather at least two weeks of after-data. Judging mid-rollout means comparing against a moving target.
Does Google tell you if an update hit your site?
No. The dashboard announces updates for everyone, and Search Console sends no per-site notice for algorithmic changes. Manual actions are the exception: they appear in the Manual actions report.
Can an update hit some pages and not others?
Yes, and that's the usual case. Core updates reassess pages, so one section can fall while another rises, and the site-wide total can hide both.
Can I recover before the next core update?
Sometimes, partly. Ranking systems reassess pages continuously, but larger recoveries after a core update often show up around a later one. Plan on months.