
Last updated: November 15, 2026
The biggest search engine conceded last December that its own default chart can hide the answer most teams want. Announcing weekly and monthly views for its site-owner reporting tool on December 10, 2025, the product team wrote that "daily fluctuations can make it hard to see if your site is truly growing or declining over time." If the team that built the report added a setting just to read the trend, a SaaS dashboard built on daily traffic swings is measuring weather.
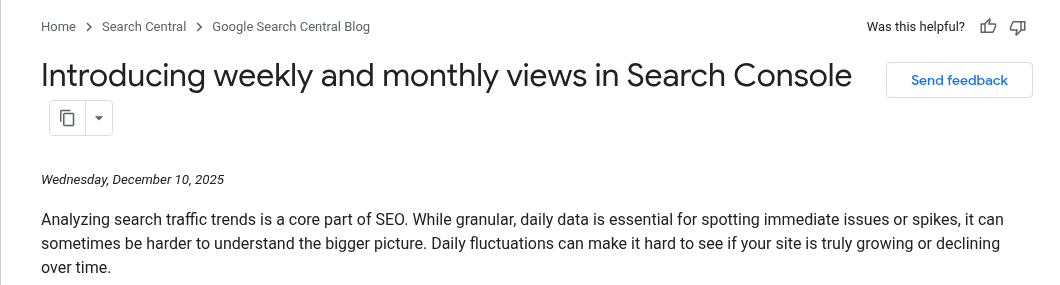
Google's weekly views post, Dec 10, 2025, captured Nov 3, 2026
The SaaS SEO KPIs worth reporting fit on one page: non-branded clicks to the pages that sell, coverage of the queries you planned for, visibility inside AI answers, and the signups and pipeline that follow. The sections that follow group them into four layers, separate leading from lagging numbers, fill in a KPI sheet for a hypothetical company and set how often each number deserves a meeting.
Why most SaaS SEO dashboards report the wrong numbers
Someone adds total sessions, someone else adds an authority score, a third person adds rank-tracker keyword counts, and a year later the dashboard has thirty tiles and nobody can say whether the program is working.
Three habits cause most of the trouble.
Total organic traffic mixes buyers with everyone else. A glossary post that ranks for a broad definition can pull more visits than every product page combined and still book no demos. When it drops, the chart panics. When it rises, the team celebrates something unrelated to revenue.
Brand searches flatter the channel. People who already know the product type its name, click the first result and convert at high rates. That demand comes from sales, events, word of mouth and paid campaigns. SEO keeps the brand result clean, but it rarely created the search.
Third-party scores stand in for outcomes. Authority scores and visibility indexes from SEO tools are estimates built on each vendor's own crawl and keyword panel. They help with comparisons. They are not KPIs, because a score can climb while signups stay flat.
A useful KPI changes a decision. If a number moving up or down wouldn't change what the team builds next month, it belongs in an appendix.
The four layers of SaaS SEO KPIs
Group metrics by how close they sit to revenue. Each layer answers a different question, and each reacts on a different clock.
Layer | Question it answers | Example KPIs | Where the data lives |
|---|---|---|---|
Visibility | Are we showing up for the queries we planned? | Non-branded impressions by page group, queries with page-one positions, AI answer impressions | Search Console, Bing Webmaster Tools, a prompt tracker |
Traffic | Are the right people clicking? | Non-branded clicks to product, comparison and integration pages | Search Console, analytics |
Conversion | Do those visits turn into product interest? | Organic signups, demo requests, trial starts from organic landing pages | Analytics plus product or CRM events |
Pipeline | Does organic show up in revenue? | Organic-sourced and organic-influenced pipeline, closed revenue | CRM |
Visibility metrics move first and prove the least. Pipeline metrics move last and prove the most. A healthy report shows all four, so a flat pipeline line in month four reads against rising visibility instead of as failure.
Search KPIs to report every month
Start with the branded queries filter in Search Console. Google introduced it in November 2025 and made it available to all eligible sites on March 11, 2026. In Google's words, branded queries "typically lead to higher-ranking pages from your site and result in higher click-through rates, whereas non-branded queries offer organic growth." That is the split a SaaS report needs, so make non-branded the default view.
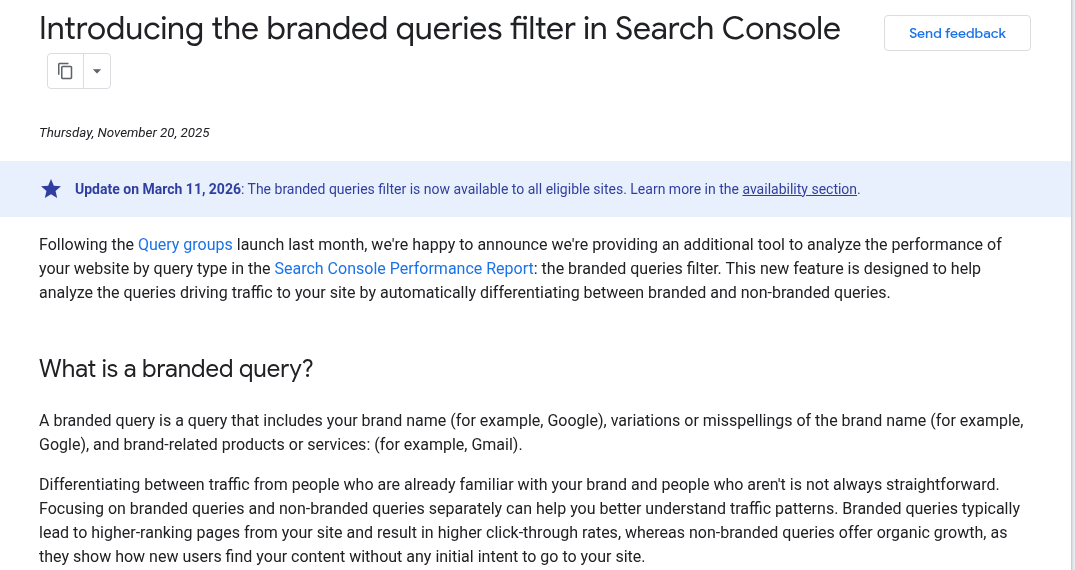
Branded filter post, updated Mar 11, 2026, captured Nov 3, 2026
Two limits apply. The classification is AI-assisted and may occasionally misidentify a query, and the filter only appears on top-level properties with enough query volume. Smaller sites can build the split with a regex on the brand name.
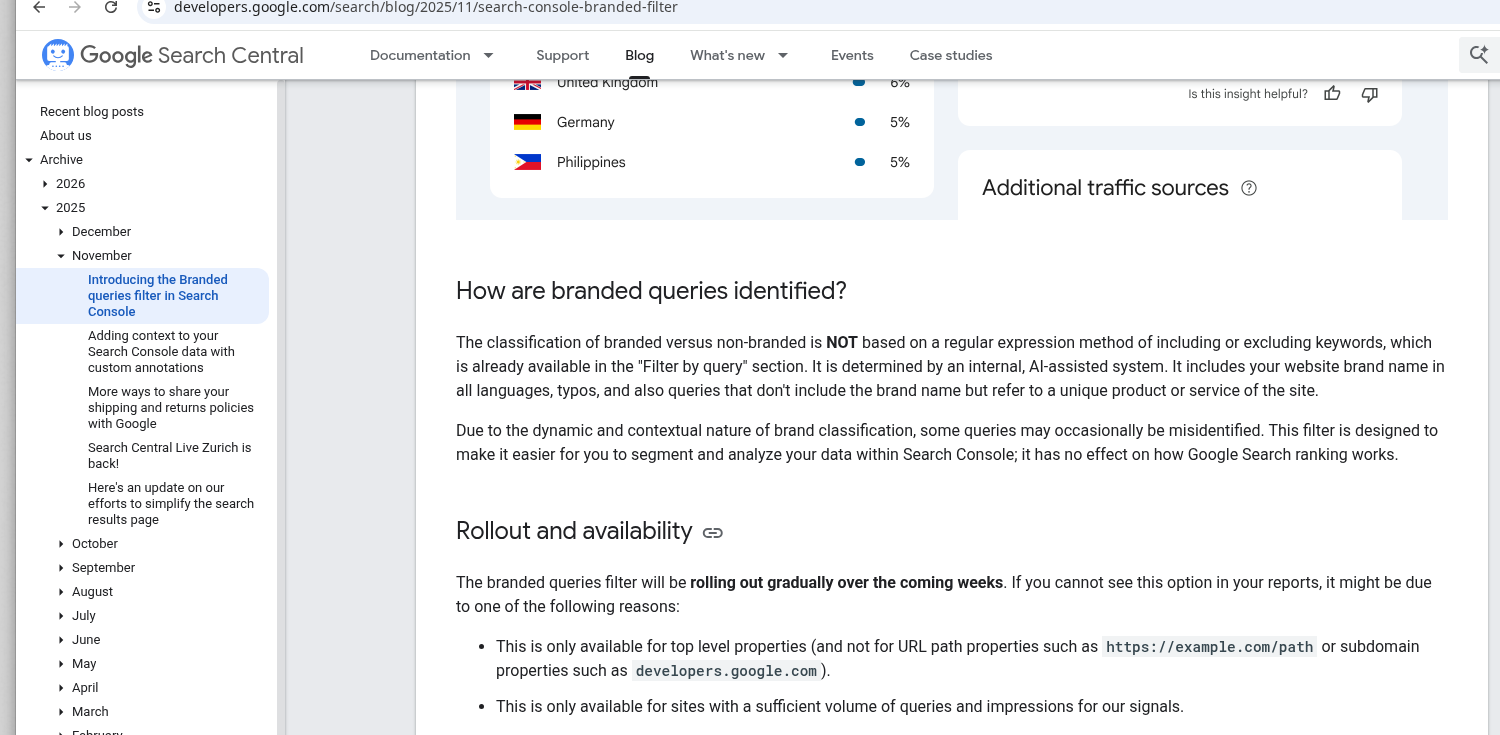
Branded filter limits: AI-assisted, top-level properties only, captured Nov 3, 2026
From there, report a short list:
Non-branded clicks by page group. Group URLs by type: product and feature pages, comparison and alternatives pages, integration pages, blog guides, docs. A rise in blog clicks and a rise in comparison clicks mean very different things for pipeline.
Query coverage. Count the planned target queries where a page ranks in the top ten. This turns a content plan into a number someone can check.
Click-through rate on pages with stable positions. A page holding position three with falling CTR may be losing clicks to an AI Overview, a video block or a stronger title. Average position on its own is a weak KPI, because it averages over every query a page touches.
Indexed share of priority URLs. If product or integration pages drop out of the index, nothing else in the report matters.
Add Bing Webmaster Tools to the same table; searches made on Bing show up there and nowhere in Search Console.
AEO KPIs: visibility inside AI answers
Search results now include generated answers, and buyers also ask assistants directly. Both need their own line in the report.
Inside Google, the Search Generative AI performance reports count impressions for URLs that appeared in AI Overviews and AI Mode, by page, country, device and date. Google rolled them out to all websites worldwide as of August 31, 2026. They carry impressions only, with no click data, so treat this as a visibility KPI. How to read the report and its gaps is covered in the guide to the Search Console generative AI report.
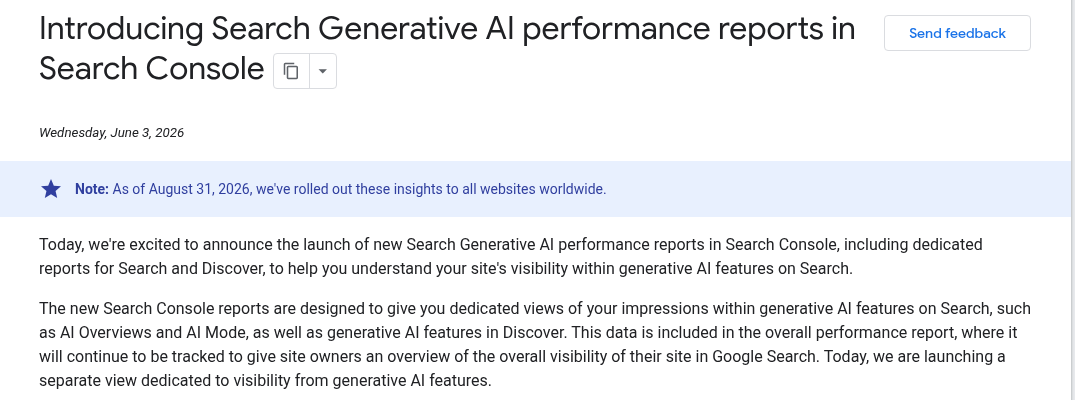
Gen AI reports worldwide from Aug 31, 2026, captured Nov 3, 2026
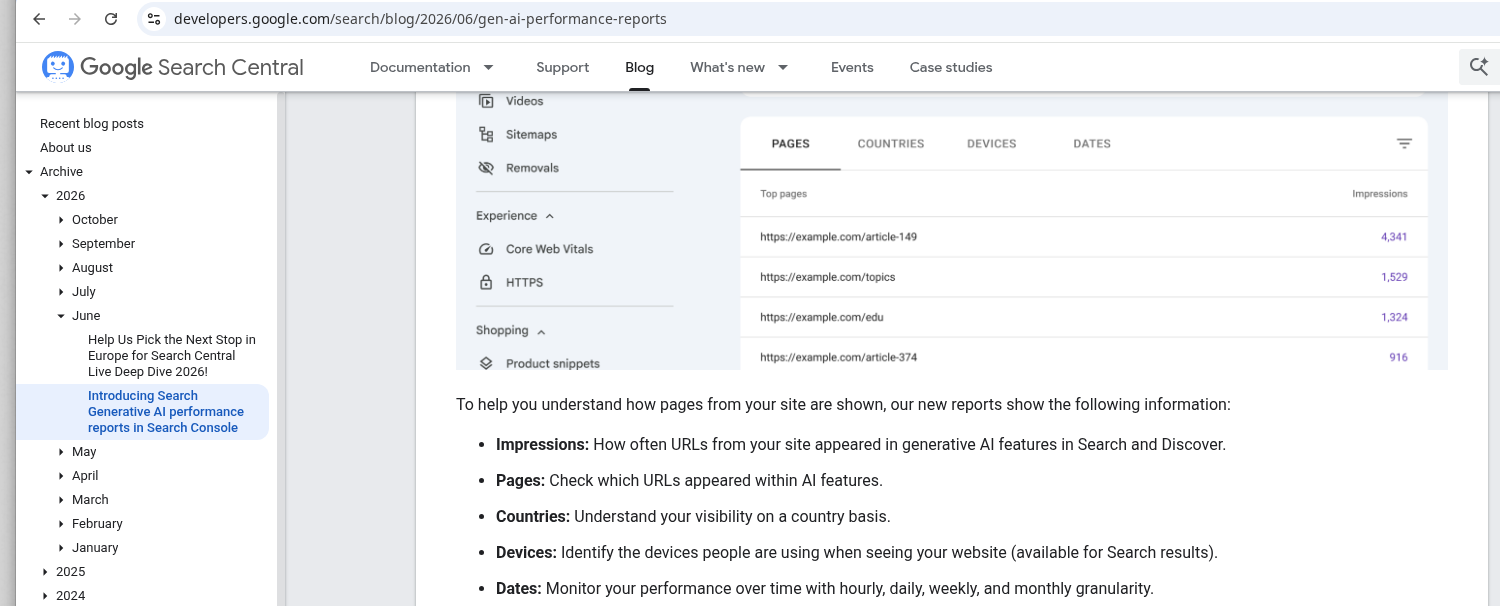
AI reports: impressions by page, country, device, date, captured Nov 3, 2026
Outside Google, no first-party report exists for most assistants. Teams fill that gap with a fixed set of buyer prompts, run on a schedule, recording whether the brand is mentioned, whether the site is cited and which competitors appear instead. The method, including how many prompts to track and how often, is in how to measure AI search visibility.
Useful AEO KPIs, then:
AI feature impressions for priority pages, from Search Console.
Mention rate across the tracked prompt set, by assistant.
Citation rate, meaning how often the answer links to your site.
Referral sessions from assistants, from analytics, read as a minimum count, since many assistant visits arrive without a referrer.
Keep the prompt set stable for at least a quarter. Changing prompts every month makes the trend line meaningless.
Conversion and pipeline KPIs
Visibility without conversion is an expensive hobby. The conversion layer asks one question: of the visits that land on organic pages, how many become product interest?
For a product-led SaaS, that's signups and trial starts with an organic landing page as the first touch. For a sales-led one, it's demo requests and contact forms. Report them by page group, the same grouping used for clicks, so the team can see which page types produce interest and which only produce reading.
Pipeline is harder. B2B deals involve several people, months of touches and a sales team that rarely records the original search. Report two numbers: pipeline where organic search was the first known touch, and pipeline where organic search appears anywhere in the path. The gap between them is informative on its own. How to set up the CRM fields, avoid double counting and handle self-reported attribution is a separate job, covered in the B2B SEO attribution guide.
Leading and lagging indicators by program stage
The right headline KPI depends on how old the program is. Judging a three-month-old program on pipeline guarantees disappointment. Judging a three-year-old program on impressions lets it coast.
Program stage | Headline KPI | Supporting KPIs | Not yet meaningful |
|---|---|---|---|
Months 1 to 3 | Indexed share of new priority URLs | Non-branded impressions by page group | Pipeline, CTR trends |
Months 4 to 6 | Query coverage on planned targets | Non-branded clicks to commercial page groups; AI feature impressions | Closed revenue |
Months 7 to 12 | Organic signups or demo requests | Mention and citation rate on the prompt set | Year-over-year comparisons |
Year 2 onward | Organic-sourced and influenced pipeline | Everything above, as diagnostics | Nothing; all four layers are live |
For typical timing at each stage, see how long SaaS SEO takes.
A worked KPI sheet for a hypothetical company
Take a hypothetical product-led project management tool, eight months into an SEO program. It has a blog, around forty comparison and integration pages, a free plan and a sales team for larger accounts. The head of marketing wants one sheet to bring to the monthly leadership meeting.
KPI | Source | Review question | Action if it stalls |
|---|---|---|---|
Non-branded clicks to comparison and integration pages | Search Console, branded filter, page group regex | Is buying-intent traffic growing month over month? | Check titles and CTR first, then internal links from the blog |
Planned queries with a top-ten page | Rank tracker against the content plan | How much of the plan is live and ranking? | Find queries where no page targets the intent, then brief new pages |
AI feature impressions, comparison pages | Search Console generative AI report | Are comparison pages appearing in AI answers? | Rewrite openings so each page answers the comparison in its first lines |
Mention rate on 40 buyer prompts | Monthly prompt run | Is the product named when buyers ask assistants? | Review which third-party pages assistants cite and get listed there |
Free signups from organic landings | Analytics, first-touch landing page | Which page groups produce signups? | Add product CTAs to guides that get clicks and no signups |
Organic-influenced pipeline | CRM | Does organic appear in sales-qualified deals? | Audit form fields and self-reported attribution before blaming content |
Every row has a named source, so nobody argues about where a number came from, and a stall action, so a flat line leads to a task.
The sheet leaves out total sessions, DR and blog pageviews. They stay in the analytics tool without a row.
What to watch out for
Reporting branded and non-branded together. A brand campaign or a funding announcement can lift organic clicks by itself. Without the split, SEO takes credit it didn't earn, or blame for a brand dip it didn't cause.
Comparing daily numbers across weeks. Weekends and holidays distort daily charts. Use weekly or monthly views for any period comparison.
Treating AI impressions as traffic. They count appearances, which is why they sit in the visibility layer and not the traffic layer.
Rank-tracker totals as a headline. "We rank for 4,000 keywords" usually counts thousands of positions on page five for queries nobody types.
Changing definitions mid-year. If page groups, the prompt set or the brand regex change, mark the date on the chart. Search Console supports custom annotations for exactly this.
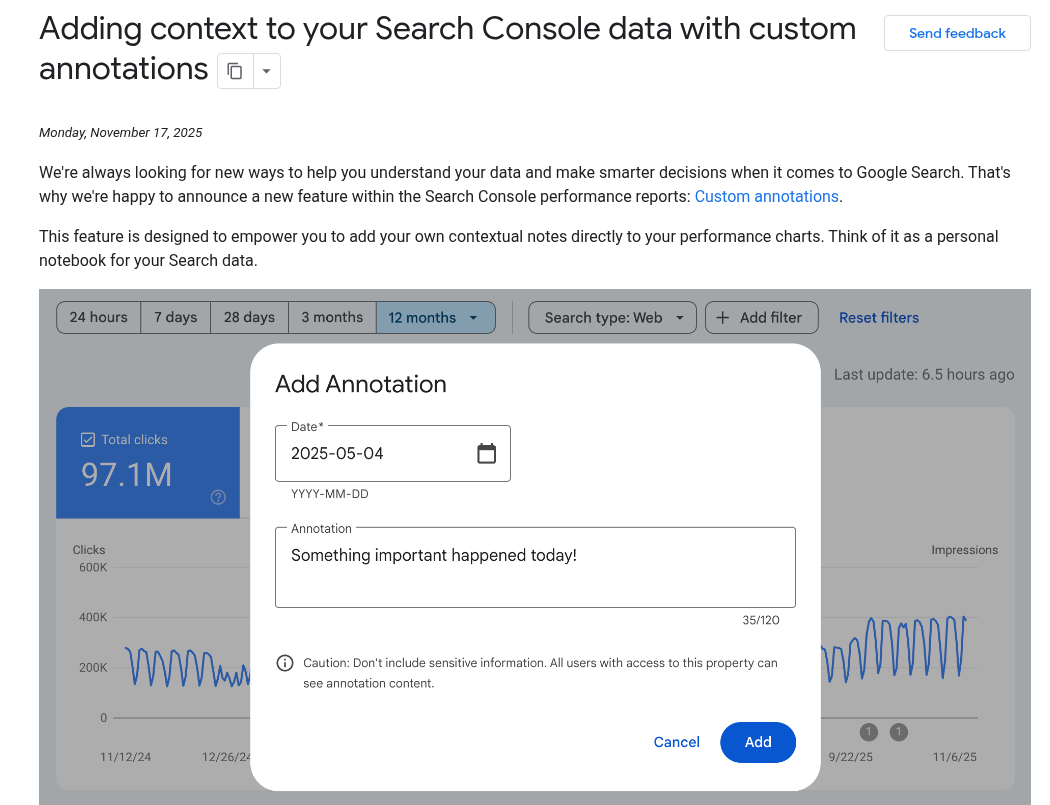
Search Console custom annotations launch, Nov 17, 2025, captured Nov 3, 2026
Vendors that report only their own scores. A partner who can't connect their work to Search Console data and signups is reporting activity.
How often to report, and to whom
Different KPIs go to different audiences. The SEO team should look at indexing, coverage and CTR weekly, since those are the numbers it can act on in days. Marketing leadership needs the monthly sheet: non-branded clicks by page group, AI visibility and conversions. The executive team needs a quarterly view of pipeline and the trend in conversions, with one paragraph on what changed and why.
Teams that want help setting up AI answer tracking alongside search reporting can see how Miraa runs it as an answer engine optimization agency.
FAQ
What are the most important SaaS SEO KPIs?
Non-branded clicks to commercial pages, coverage of planned target queries, organic signups or demo requests, and organic pipeline. Add AI answer visibility as a fifth, since buyers can meet a brand inside a generated answer before they click anything.
Is organic traffic a good KPI for SaaS?
As a single total, no. It mixes brand searches with everything else and treats a glossary visit the same as a pricing visit. Split it by branded versus non-branded and by page group, and it becomes useful.
How do you measure SEO for AI search?
Use the generative AI performance report in Search Console for Google's AI features, and a fixed set of buyer prompts, run monthly, for assistants that don't offer a report. Track mention rate, citation rate and referral sessions.
How often should SEO KPIs be reviewed?
Weekly for technical and coverage metrics, monthly for clicks, AI visibility and conversions, quarterly for pipeline. Pipeline moves too slowly to read monthly.
Should DR be a KPI?
No. It's a third-party estimate, and it can rise while signups stay flat. Use it to compare sites during research, and keep it off the KPI sheet.
Building a KPI sheet that survives the quarter
Pick six to eight metrics across the four layers, name the source for each, write down what the team will do if it stalls, and agree on which ones matter at the current stage of the program. Review the sheet itself every six months and drop anything nobody acted on.